
GUI visualization#
Use the Visualization tab to inspect images and mask overlays before processing or to check the results of preprocessing and filtering.
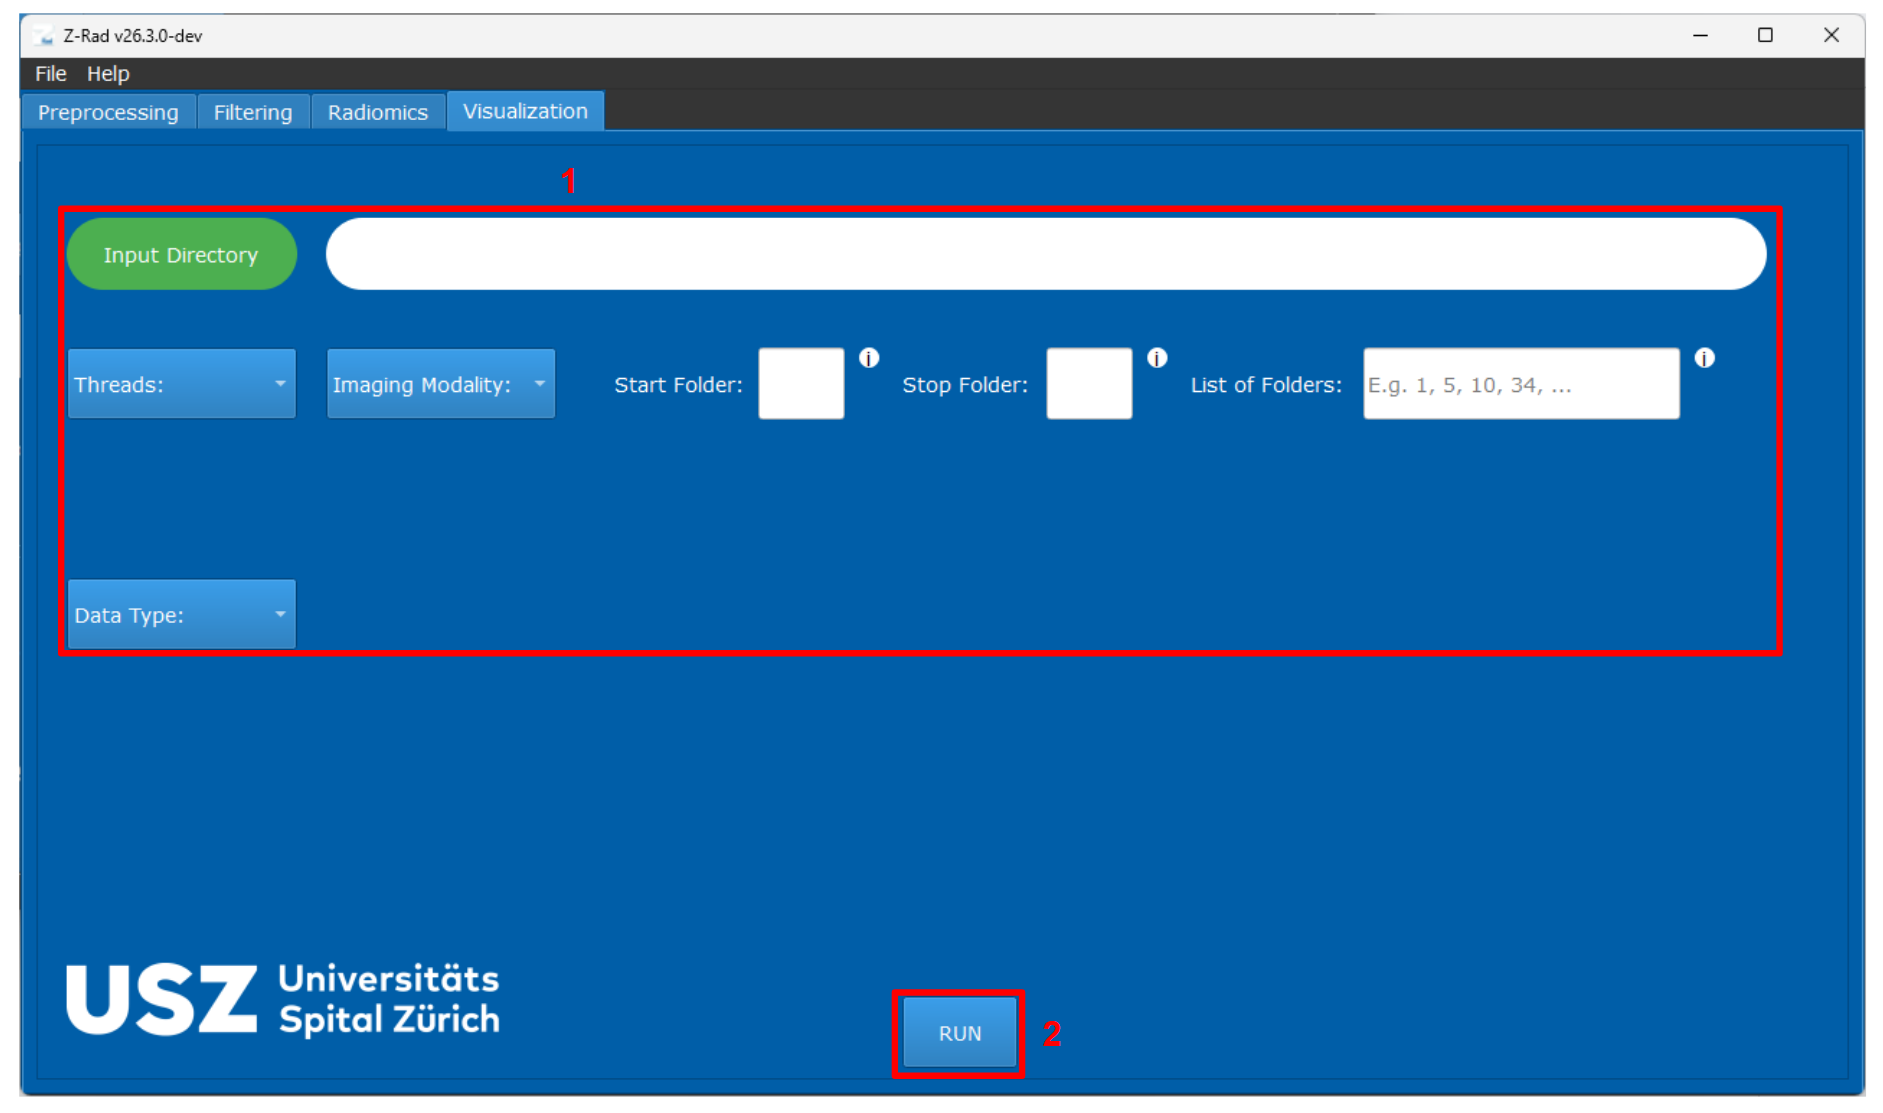
Visualization tab in the GUI.#
Main controls#
The numbers below match the annotated screenshot.
(1)Upper workflow sectionThe upper part of the visualization tab follows the same dataset-selection pattern as preprocessing, except that no output directory is required. Use this section to select the input directory, imaging modality, thread count, and the folders that should be opened.
(2)RUNLoads the selected images and opens the dedicated visualization window.
Viewer window#
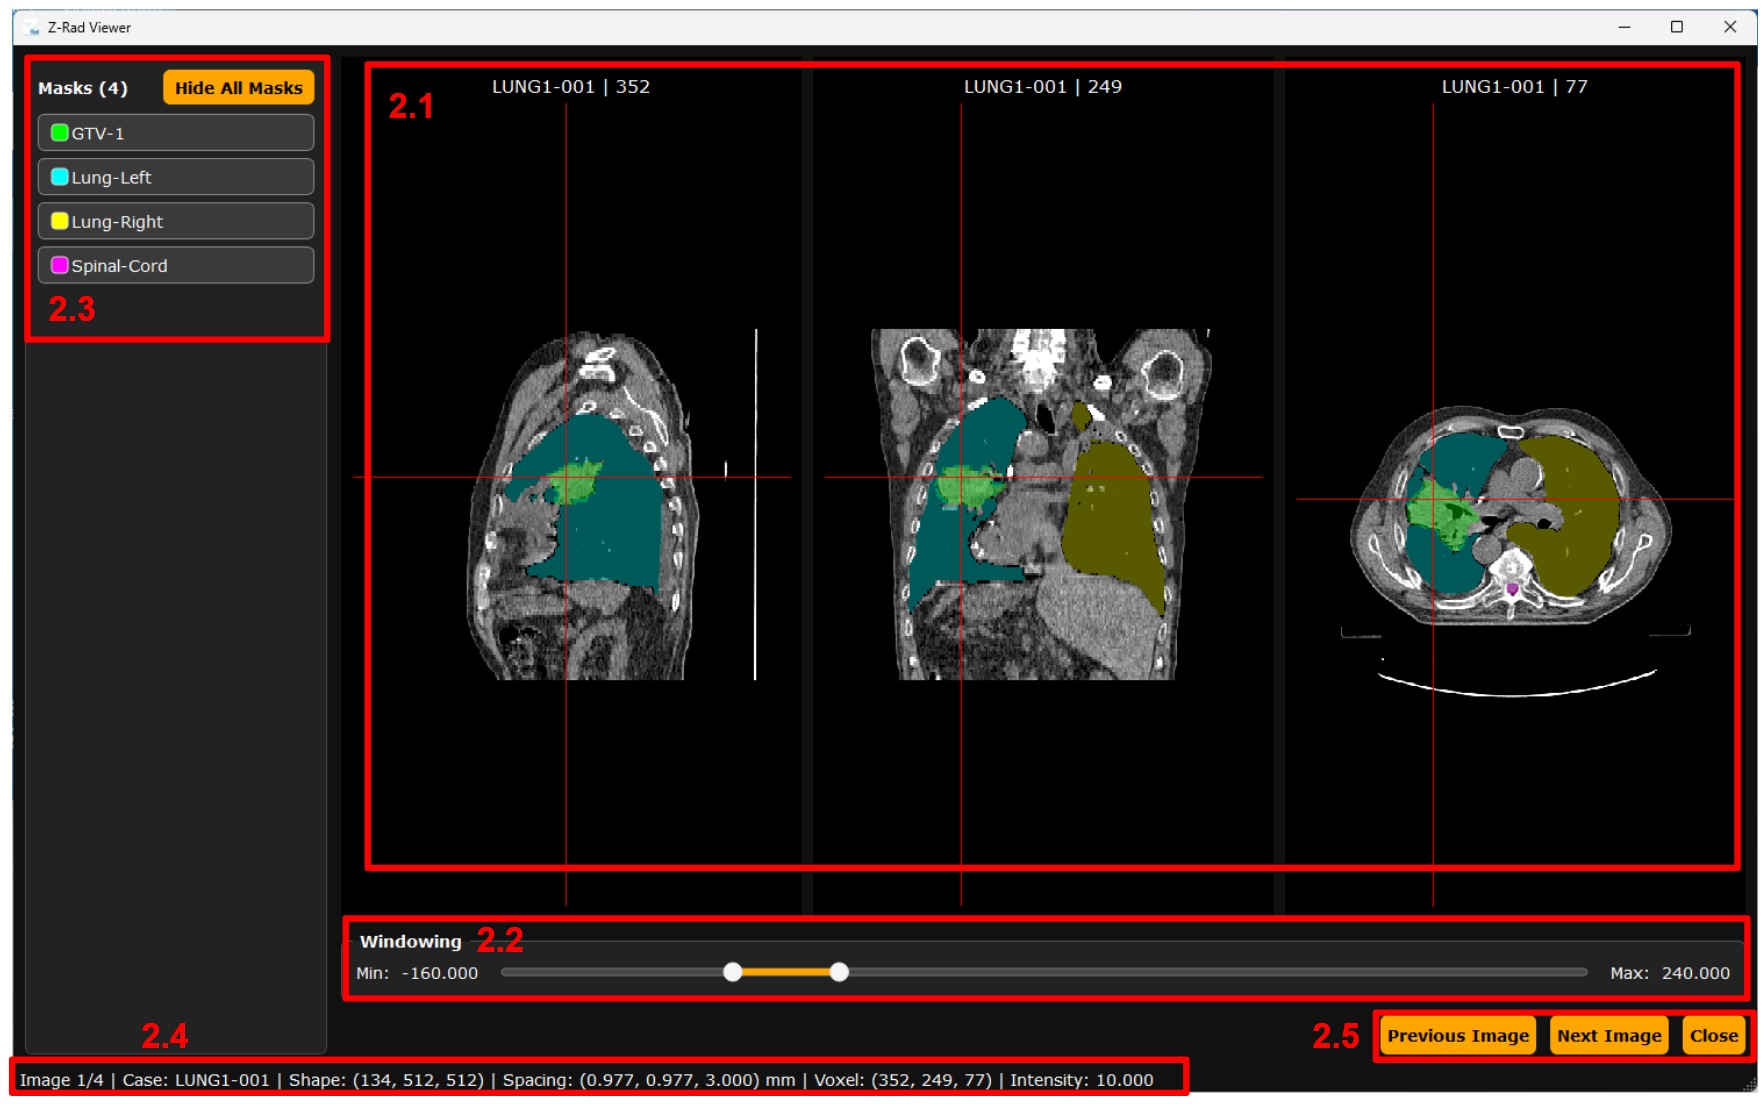
Visualization window for image and mask inspection.#
Use the viewer controls to inspect each case:
(2.1)Projection panesThe upper part of the viewer displays three orthogonal projections. These views can be scrolled and zoomed, and double-clicking one of them expands it to full-screen for closer inspection.
(2.2)Windowing controlsAdjust the displayed intensity range to see the tissue or image response of interest.
(2.3)Mask visibility controlsMasks can be hidden individually or all at once with the
Hide All Maskscontrol.(2.4)Image information panelCheck the folder name, image shape, voxel spacing, cursor position, and intensity at the current voxel.
(2.5)Navigation controlsUse these controls to move through the loaded images and slices.
Check alignment before extraction#
Scroll through the ROI in all three views and confirm that the mask covers the intended region. Check the image spacing and dimensions in the information panel if the overlay looks displaced or distorted. See Troubleshooting for alignment checks.